Review of Z Scores
The normal distribution describes a theoretical distribution of values that follow
a specific mathematical formula. Although normal distributions may have different means
and standard deviations, all normal distributions are "bell-curve" shaped,
symmetrical with a peak at the mean (see Figure 1 for examples). Tails of a normal
distribution are asymptotic, indefinitely decreasing but never touching the x-axis.
The total area under the standardized normal curve sums to 1.00 (i.e., 100%).
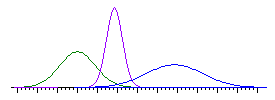
Figure 1. Three normal distributions whose means and standard deviations
vary
Some measurements in the natural world may approximate normal distributions (e.g.,
perhaps the weights of adult hippopotamuses, heights of palm trees, students' IQs, and
people's happiness). The normal distribution may characterize distributions of individual
data points in some populations of scores, a large sample drawn from such a population, or
the theoretical distribution of sample statistics such as the mean. For more information on
the normal distribution and its history, see
this
article from Wikipedia.
- The normal distribution is important in inferential statistics because certain
theoretical distributions, such as the distribution of possible means, can be very
close to normal even when the population distributions are not normal.
- By using the areas underneath normal distributions, we can calculate
probabilities of different outcomes, including how likely it is to obtain a
mean within a certain range.
Important note: Before we use the normal distribution to compute probabilities,
we must verify that the shape of the distribution of interest is very close to normal.
Standard Normal Distributions and Z Scores
A normal distribution that is standardized (so that it has a mean of 0 and a SD
of 1) is called the standard normal distribution, or the normal distribution of
z-scores. If we know the mean m ("mu"),
and standard deviation s ("sigma") of a set of
scores which are normally distributed, we can standardize each "raw" score,
x, by converting it into a z score by using the following formula on each
individual score:
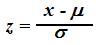
A z score reflects how many standard deviations
above or below the population mean a raw score is. For
instance, on a scale that has a mean of 500 and a standard deviation of
100, a score of 450 would equal a z score of (450-500)/100 =
-50/100 = -0.50, which indicates that the score is half a standard
deviation below the mean.
- Note that converting x scores to z scores does NOT
change the shape of the distribution. The distribution of z scores
is normal if and only if the distribution of x is normal.
By converting normally distributed scores into z scores,
we can ascertain the probabilities of obtaining specific ranges of scores
using either a table for the standard normal distribution (i.e., a z
table) or a calculator like
the
WISE p-z converter.
Caution: It is not appropriate to use the z table to find
probabilities unless you are confident that the shape of your distribution
of interest is very close to the normal distribution!
Calculating a Z Score and Probability
Q1: Suppose that SAT scores among U.S. college students are normally
distributed with a mean of 500 and a standard deviation of 100. What is the
probability that a randomly selected individual from this population has an
SAT score at or below 600?
Solve this yourself now. You may use either a z table of probabilities or
the
p-z converter to find the desired probability.

Using the formula to calculate the z value, we find z =
(x - m)/s =
(600 - 500)/100 = +1.00. Recall that the z-score is the number of standard
deviations that the score of interest differs from the mean. A score of 600 is
one standard deviation above the mean, so it has a z value of 1.00.
Using either a z table or the p-z converter, we find
that the probability that a randomly selected z score in a normal
distribution will exceed z = 1.00 is .159, the right-tailed p value,
or about 16%.
The probability that z will exceed 1.00 for a randomly selected score is
equivalent to the probability that a randomly selected individual from this
population will have an SAT score over 600, about 16%. The probability that a
randomly selected individual from this population will have an SAT score below 600
is 100% - 16% = 84%, which is the left-tailed p value, .841, as
shown in the graphical version of the p-z calculator (click on the
"Graphic" button and enter in a mean of 500, a standard deviation of 100,
and a raw score of 600--be sure to press "Enter" or "Return" on
the keyboard after each entry).
With a continuous distribution, the probability of any exact value is essentially
zero. Consider, for example, the probability that someone is exactly 66 inches tall.
If we measure with enough precision, the probability that someone is exactly
66.000000… inches tall is essentially zero. If we measure to the nearest whole
inch, then we may consider anyone between 65.5 and 66.5 inches tall to be 66 inches
tall. The probability of observing someone in this interval is greater than zero. If
the distribution of height is approximately normal we could estimate the probability
of someone being 66 inches tall (to the nearest inch) by finding the difference
between the probability of being taller than 65.5 inches and being taller than 66.5
inches. This difference corresponds to a range on the normal distribution,
which has a probability greater than zero.
In practice, SAT scores are measured in intervals of 10. Thus, SAT scores do not
produce a truly continuous distribution, and so the distribution cannot be truly
normal. No individual scores are observed between 501 and 509, and the probability of a
score exactly equal to 500 is greater than zero. If the distribution of SAT scores is
approximately normal, computations based on the normal distribution will at best only be
approximately accurate. Thus, we report our answer as about 16%, rather than 15.9%.
[Go Back]
Questions, comments, difficulties? See our
technical support page or contact us: wise@cgu.edu.
|