Description of the WISE Power Applet
Note: this is not a 'live' applet.
Overview
This applet simulates a test of the null hypothesis
that the population mean is equal or less than a specified value (e.g.,
μ ≤ 100). The alternative hypothesis is that the population mean
is greater than this value (e.g., μ > 100). We assume a normal
population distribution with a known standard deviation (e.g., σ
= 15) so we can conduct a one-tailed z test.
The user can enter desired values into the text
boxes or use a mouse to drag the mean of the Alternate Population, the
sample size, or power to see how a change of one value affects others
Place the cursor over different parts on the picture above for a description of
applet features.
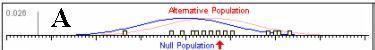
A: Population distributions and a sample
The population distribution assumed by the null
hypothesis is shown in blue (Null Population) while the actual
population from which our sample is drawn (Alternative Population) is
red. When we click the Sample button (C) a sample of n cases
represented by yellow boxes is drawn from the Alternative Population.
The sample mean is indicated by the red arrow. The mean is also shown by
an arrow in B and numeric value in F.
The mean of the Alternative Population can be increased or decreased by
dragging the distribution with the mouse. Place the cursor near the
population distributions, hold the left mouse button, and move left or right.
The value of the Alternative Population mean can also be changed by
entering a new value in the text box,
μ1, in D.
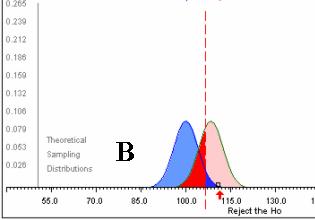
B: Sampling distributions and a sample mean
The blue sampling distribution is the theoretical distribution of all possible
sample means for samples of size n drawn from the Null
Population. The comparable distribution for samples drawn from the
Alternative Population is shown in pink (and
red). The red arrow and black box indicate the mean of the last sample. If the
sample mean is greater than a critical value (indicated by the vertical red
dashed line) we conclude that it is unlikely that the sample was drawn from the
Null Population and we reject
H0.
The dark blue area to the right of the critical value represents the alpha
error set by the data analyst, the probability of rejecting a true null hypothesis.
The pink area to the right of the critical value represents statistical power, the
probability of rejecting the null hypothesis when we actually are sampling from
the Alternative Population.
C: Draw a sample
Click this button to draw a sample of size n from the Alternative
Population. The n observed scores are shown as yellow boxes. The mean is
indicated with a red arrow in A and B. The numeric value of the mean, the
z-score on the Null Population, the p-value,
and the decision (reject or fail to reject H0) are shown in F.
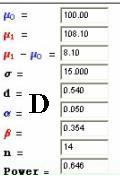
D: Population values, sample size, and power
Values for the population means (μ0
and μ1), the standard
deviation (σ), the effect size (d),
alpha (α) and beta error rates
(β), sample size
(n), and power may be entered by the user. Highlight the value in a box, replace
it with a new value, and press Enter to activate.
In the live applet you can click on each term for a brief description.
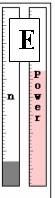
E: Thermometers for sample size n and power
Click on a desired height of the n thermometer to
change the sample size from 1 to 100.
Hold down the left mouse button on the Power
thermometer and drag up or down to change power. A left-click above
the level of power will increase sample size by 1, while a click below
the power level will decrease the sample size by 1.
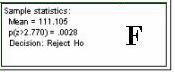
F: Sample information
After a sample is drawn this box shows the sample
mean, the z and p values associated with the null distribution, the
critical value, and the decision (reject or fail to reject H0).
Questions, comments, difficulties? See our
technical support page or contact us: wise@cgu.edu.
|